
Identifying Peak Sales Days and Hours
Use Putler sales heatmaps and time analysis tools to discover which days and hours generate the highest revenue.
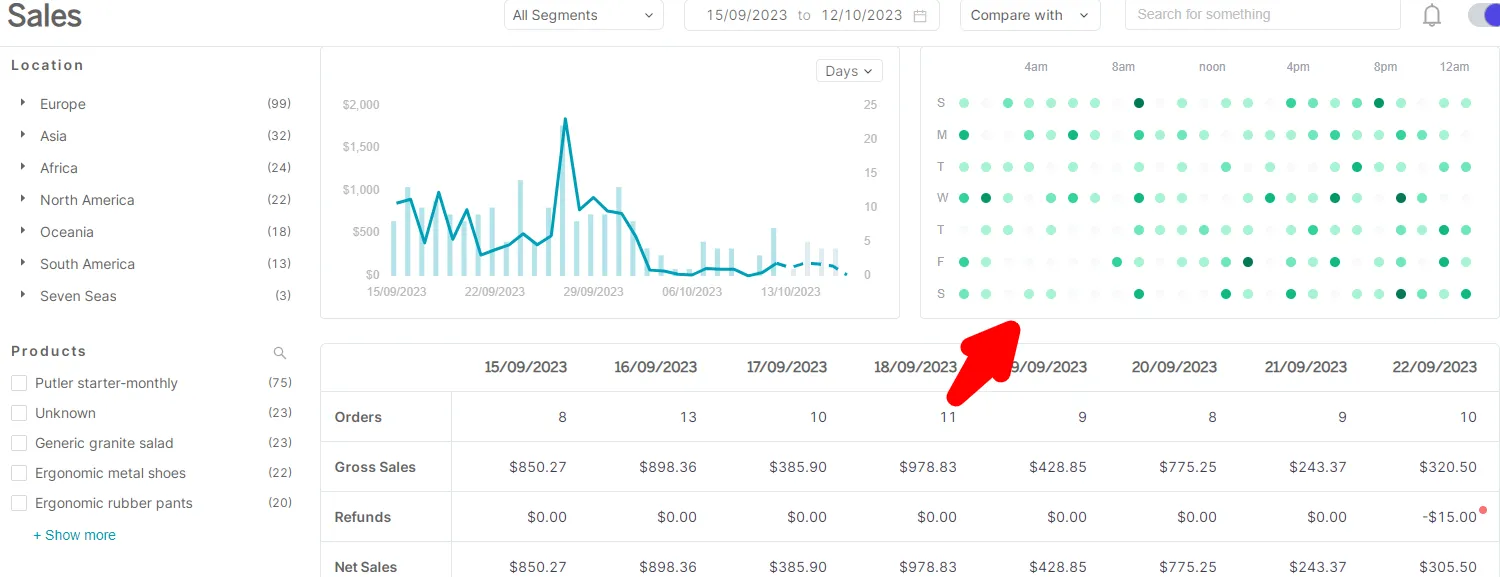
Yes, you can view the sales by day and hour on the Sales Dashboard through the Sales Heatmap. This heatmap visually represents the sales activity in your store, highlighting the hours of the day when you have the highest and lowest number of visitors. Analyzing this data can help you identify your best-performing days and times, allowing you to plan promotions and discounts more strategically to maximize sales.
You can find the Sales HeatMap on the top corner of the Sales Dashboard.